Chrome DevTools MCP MCP server
The Chrome DevTools team's MCP server that lets a coding agent control and inspect a live Chrome browser, including performance traces, network requests and console messages.
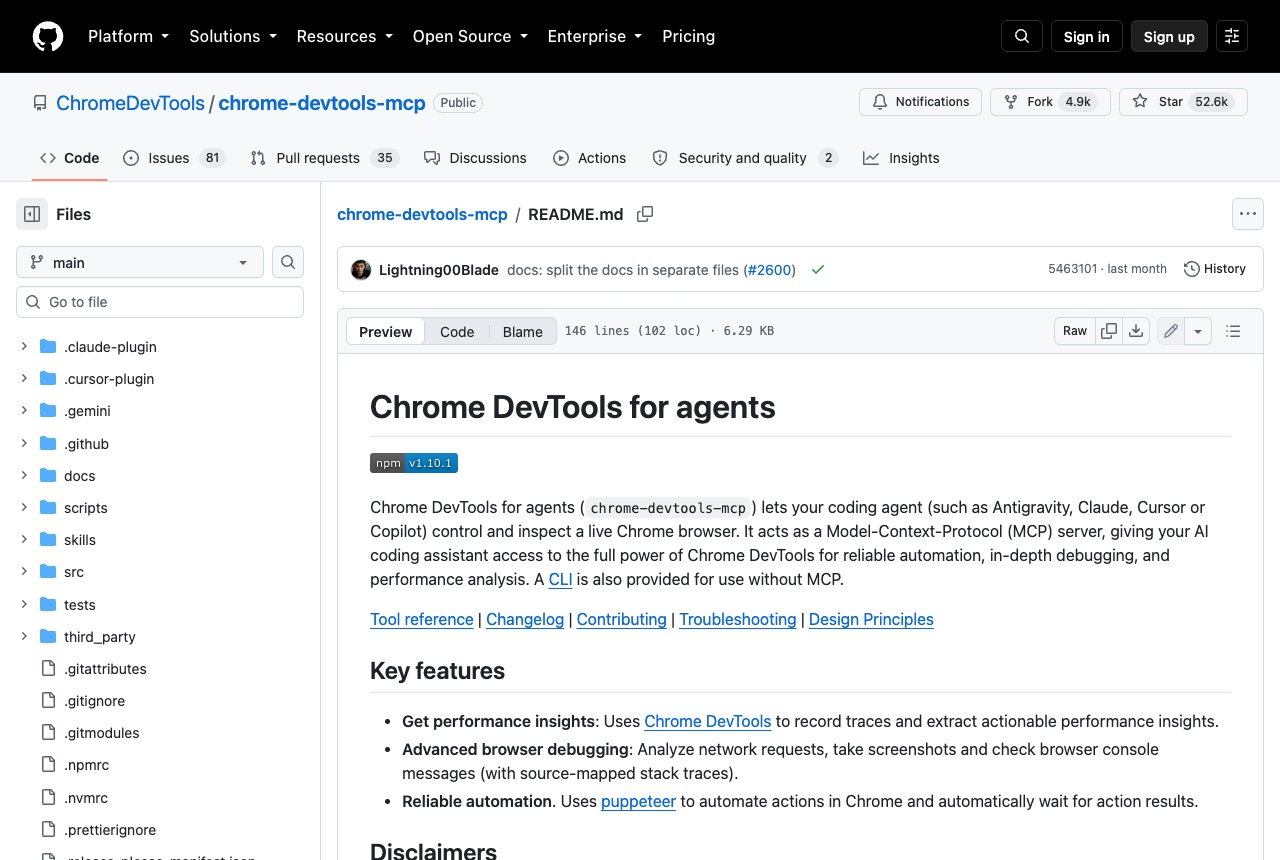
Chrome DevTools MCP, which its README now titles Chrome DevTools for agents, is an MCP server from the Chrome DevTools team. It lets a coding agent control and inspect a live Chrome browser: record a performance trace and pull insights out of it, read network requests and console messages with source-mapped stack traces, take screenshots, and automate actions through Puppeteer, waiting for each result. It needs a current Node.js LTS, npm and Chrome stable. The README's config is an entry named chrome-devtools running npx with the arguments -y and chrome-devtools-mcp@latest. For Claude Code its client guide gives: claude mcp add chrome-devtools --scope user npx chrome-devtools-mcp@latest We find it most useful when the question is why something is slow or broken rather than whether it works. Asking the agent to check the performance of a page and explain what it found, or to find the failing request behind an error, puts the same evidence a developer would open DevTools for in front of the model. Read the disclaimers before connecting it. The server exposes the content of the browser to the MCP client, so the docs advise against using it with sensitive or personal information. Google collects usage statistics by default, which --no-usage-statistics turns off, and performance tools may send trace URLs to the CrUX API unless you pass --no-performance-crux. Only Chrome and Chrome for Testing are officially supported.
Logs that used it
Nothing written with this yet. An entry lands here the moment somebody names this tool in one — attach it from the composer’s + menu.
Reviews 0
No reviews yet. Rate it from what you built with it.
Sign in to rate Chrome DevTools MCP